Posts

Showing posts from November, 2020

Donate

Bootstrap Table Cell Dynamic Background Width

Image
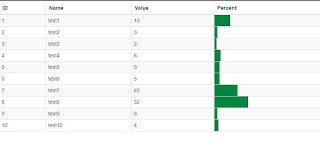
Good morning fellow programmers! I was recently tackling a task of which to set the Bootstrap Table cell by Wenzhixin background width dynamically based on a given value. Given that a the value to be accounted for is 25, then the table cell's background color should span to 25 pixels or percent only and not fill the entire table cell. To do that you need to create a custom function that will be used as the data-cell-style of a table column. The function below will return the css formatting of a table cell by setting the attributes color, background-image, background-repeat and background-size using the referenced value. function PercentBarCellStyle(value, row, index) { var classes = [ 'active' , 'success' , 'info' , 'warning' , 'danger' ]; var size = row.value.toString() + "% auto" ; return { css: { "color" : "transparent" , "background-image" : "url('https://add_you

How To Export Hidden Column In Bootstrap Table

Good afternoon. In one of my projects I had a requirement which is to export a hidden column or hidden columns in Bootstrap Table of Wenzhixin. This hidden column is a note field that contains long text of more than a hundred characters. The value of the hidden column is used in one of the column that contains an image icon and when hovered will show the value of the invisible column. The Bootstrap Table does not have this feature but a temporary solution was provided by lutol in the github issue How to export hidden column . However upon testing, the accepted solution does not work on my part since it cannot retrieve the hidden columns defined in the exportHiddenColumns property. So I made some changes in some of the logic to export the hidden column on my project. The changes are the following. 1. Create a data-hidden-columns attribute in the table and set it's value with the invisible column name. An example is the JobNotes column' data-visible property is set to false.

Power BI Add Leading Zero (0) To Month In DirectQuery

Image
Good noon! I was recently confronted with an issue on dates not sorted correctly of which a date with this value 2020/10 (October 2020) appears in between of 2020/2 and 2020/1. This was based from an article I read on how to change the current date into a Current Month string and the data type for this calculated column is Text . As you can see from the image below, month of November which is the current month is translated as " Current Month ". But October 2020 is in between January and February 2020 respectively. And here's the calculated column DAX script. Current Month = IF ( MONTH ( 'SalesOrder' [OrderDate] ) = MONTH ( NOW () ) && YEAR ( 'SalesOrder' [OrderDate] ) = YEAR ( NOW () ), "Current Month" , YEAR ( SalesOrder[OrderDate] ) & "/" & MONTH ( SalesOrder[OrderDate] ) ) Since my datasource came from SQL Server database and the storage mode is DirectQuery , I can't just

Bootstrap Modal In ASP.NET MVC With CRUD Operations

Image
Good afternoon fellow developers! I have been working with Bootstrap Modals before and it's time to demonstrate its significance using a simple ASP.NET MVC CRUD (Create Update Delete) application project using Entity Framework Database First approach. First is to create a basic BookDetails table on your SQL Server instance. USE [DemoDB] GO /****** Object: Table [dbo].[BookDetails] Script Date: 11/2/2020 12:26:53 PM ******/ SET ANSI_NULLS ON GO SET QUOTED_IDENTIFIER ON GO CREATE TABLE [dbo].[BookDetails]( [BookSerialNo] [int] IDENTITY (1,1) NOT NULL , [BookISBN] [ nchar ](15) NULL , [BookTitle] [varchar](120) NULL , [BookAuthor] [varchar](60) NULL , [BookPublisher] [varchar](50) NULL , [BookCategory] [varchar](20) NULL , PRIMARY KEY CLUSTERED ( [BookSerialNo] ASC ) WITH (PAD_INDEX = OFF , STATISTICS_NORECOMPUTE = OFF , IGNORE_DUP_KEY = OFF , ALLOW_ROW_LOCKS = ON , ALLOW_PAGE_LOCKS = ON ) ON [ PRIMARY ] ) ON [ PRIMARY ] GO Next is to create an ASP.

Power BI Hierarchy Slicer Display Employee Hierarchy Data

Image
Good evening fellow developers, Here's how to display an employee hierarchy (employees and their supervisor/manager) using the Power BI Hierarchy Slicer custom visual. For this tutorial, I'm using the ContosoRetailDW database which can be downloaded from Microsoft's SQL Server database examples. This SQL Server database already has an Employee table of which an employee is assigned with a parentkey attribute. Next is to create a view that will be used as the Power BI's dataset. This view will has the employee name, employee id, manager name and manager id columns used in generating hierarchical levels in Power BI. Use ContosoRetailDW Go Create View vwEmployeeManager As SELECT [EmployeeKey] as [Employee ID] ,([FirstName] + ' ' + IsNull ([MiddleName], '' ) + ' ' + [LastName]) as [EmployeeName] , IsNull ([ParentEmployeeKey], 18) As [ManagerID] , IsNull (( Select [FirstName] + ' ' + IsNull ([MiddleNa

Donate