Posts

Donate

Power BI Hierarchy Slicer Last Item Cut Off In Power BI Service

Image
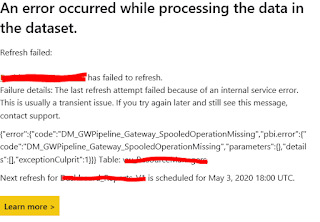
Good evening Gents. I have been using the hierarchy slicer for quite some time and this has helped me solve the grouping mechanism of our reports. Lately, we have found issues such as the slicer is not working on Firefox and today, the last item of the slicer is cut-off/not visible even when you scroll. The issue appears on both Google Chrome and Microsoft Edge browsers. See screenshot below: When I checked on the docs,there's an open issue about the slicer's last item is cut-off if the search box is enabled. Don't know if this issue is related to that. See details here:  https://github.com/liprec/azurebi-docs/issues/124 . Even if I replaced the slicer with the recent version (2.1.4) still the issue appears. Upon doing some experiments, I came up with a solution and presented it to our Software Architect for approval.  Note that this is not the best solution, this is just a temporary workaround. I still recommend for the bug to be fixed and release a version that solves t

How To Combine Specific Columns Per Table Using DAX Union

Guys, Here's a DAX formula that will perform union of two tables given their specific column names in Power BI. The trick is to use SELECTCOLUMNS () function for each table. Countries = UNION ( SELECTCOLUMNS ( 'Main Location' , "Countries" , 'Main Location' [Countries] ), SELECTCOLUMNS ( 'Sales' , "Countries" , 'Sales' [Countries] ) )

Line Chart X-Axis Month Values Not Sorting Correctly In Power BI LineChart

Image
Gents, Today, I had an issue with month values in my line chart visual not sorting correctly. The month values were plainly text in type and it seems the line chart does not recognize it's order. In order for these to work, I need to create a month column to explicitly include the year and retrieve the value using DateValue() function. If the measure is added in the visual, set the proper date format in Power BI desktop for the line chart to recognize the proper sequence. MonthYear = var monthName = TRIM (GrossProfitTrend[MonthName]) Return SWITCH(monthName, "Jan" , DATEVALUE( MONTH ( DATE ( YEAR (NOW()), 1 , 1 )) & " " & YEAR (NOW())) , "Feb" , DATEVALUE( MONTH ( DATE ( YEAR (NOW()), 2 , 1 )) & " " & YEAR (NOW())) , "Mar" , DATEVALUE( MONTH ( DATE ( YEAR (NOW()), 3 , 1 )) & " " & YEAR (NOW())) , "Apr" , DATEVALUE( MONTH ( DATE ( YEAR (NOW()), 4 , 1 )

Add Row Number Dynamically To Query Results In T-SQL

Image
Aloha fellow developers! I have this scenario wherein I need to display row numbers in my result set given that the rows don't have a ID column and each row number represents the month number of a specific month. SELECT A.fsyear_num as 'Fiscal Year' , [MonthName] FROM CTE_GrossProfit_SalesByClass_Current_FSYear A I know that row number is the solution but I need to tweak this to handle my requirement. After reading the forums and docs, I found out that adding a select statement with COUNT() inside the Over By clause is the solution. SELECT A.fsyear_num as 'Fiscal Year' , ROW_NUMBER() Over( Order BY ( Select Count ( * ))) AS MonthNum, [MonthName] FROM CTE_GrossProfit_SalesByClass_Current_FSYear A ORDER BY MonthNum ASC

Function Format In DAX Not Allowed In DirectQuery Calculated Columns When Formatting Dates

Good evening fellow developers, I have a scenario wherein I will set the default value of a slicer to the current month by default. A link in the forums presented the solution below. Current Month = IF( MONTH ( 'Transactions' [transdate]) = Month (NOW()) && YEAR ( 'Transactions' [transdate]) = YEAR (NOW()), "Current Month" , Format( 'Transactions' [transdate], "YYYY mmmm" )) Since, I'm using DirectQuery connection, the Format() function isn't allowed in calculated columns. After doing some tweaking on my column, the fix that I've come up with was to extract the month and year individually and concatenate them and return that value to the Current Month column. Current Month = IF( MONTH ( 'Transactions' [transdate]) = Month (NOW()) && YEAR ( 'Transactions' [transdate]) = YEAR (NOW()), "Current Month" , Year ( 'Transactions' [transdate]) & "/" & Month

Power BI Nested Filter Function Alternative In DAX

Image
Hello Team, I've started learning grasping the concepts of DAX through videos and blog posts using DAX Studio since most of the tasks I'm currently working are Power BI reports. I also want to experiment on how can I simplify or modify the formula using other functions so as to make it easier to understand. One example is a nested Filter() formula below. EVALUATE FILTER ( FILTER ( Products, Products[UnitPrice] > 50 ), Products[UnitsInStock] > 10 ) The first parameter of the outer FILTER() function is another filter which returns a table Products with UnitPrice of greater than 50. Then the second parameter filters the table returned by removing Products whose UnitInStock is less than or equal to 10. Upon recognizing the formula, I can simplify that to use AND() function and pass those two filter conditions in the function. The simplified formula, returns same results. EVALUATE FILTER ( Products, AND ( Products[UnitPrice] > 50 , Products[UnitsInStock]

Power BI: DM_GWPipeline_Gateway_SpooledOperationMissing Error On Premises Data Gateway

Image
Hello Team, After configuring dataset refresh of our reports, we've been receiving this error called "DM_GWPipeline_Gateway_SpooledOperationMissing" for a month now and we have done a lot of research and possible solutions based from the forums and technical blogs. But none of them worked. Few weeks later, I just learned from our Lead Architect that the Virtual Machine of where the data gateway is setup was cloned. Due to the machine being cloned, both machines must have run the data gateway. So uninstalling the data gateway from the cloned machine solves the issue. Cheers

Format Negative Numbers In DAX Using Parenthesis Instead Of Negative Sign In Power BI

Here's a simple DAX formula that I learned from the forums on how to show the negative numbers into the Matrix Visual without negative sign but enclosed in parenthesis. Month Sales Formatted = FORMAT([ Month Sales Measure], "#,##0;(#,##0)" ) Cheers!

Remove Other SQL Or Duplicate DataSources In Power BI Desktop

Image
Good evening fellow developers. I have a Power BI Desktop file that points to two data sources. The two data sources references to one server but different databases. Since I will be using one database for now, I need to remove the other data source. Example datasources from the image are: CebuServer;DatabaseTest1 CebuServer;DatabaseTest2 I need to remove the datasource that points to DatabaseTest2 but there's no option to remove that. So in order to remove the DatabaseTest2 datasource, select that datasource and click Change Source button. The SQL Server database dialog will show up. Simply replace the Database name from DatabaseTest2 (The datasource to be removed) to DatabaseTest1 (the datasource to be retained) then click OK. The redundant or unused datasource will be removed. Cheers!

Power BI : Count Rows Using RowCount Not Working

I have this DAX formula that counts the number of rows using Calculate() function with [RowCount] as the expression and a certain condition as the filter. CountARCurrent = CALCULATE([RowCount], AccountsReceivablesAging[ Current ] > 0 ) This works on most of the report's dataset however when I tried importing a new dataset, the formula above didn't work. The data used in the filter is a floating point number and the datasets involved in this project are imported via Direct Query. After searching the Power BI forums, I found an alternative solution which is to use COUNTROWS() function instead of [RowCount] as the expression. CountARCurrent = CALCULATE(COUNTROWS(AccountsReceivablesAging), AccountsReceivablesAging[ Current ] > 0 )

Donate